
Short Call Spread
A short call spread obligates you to sell the stock at strike price A if the option is assigned but gives you the right to buy stock at strike price B...

Short Put Spread
A short put spread obligates you to buy the stock at strike price B if the option is assigned but gives you the right to sell stock at strike price A....

Long Straddle
A long straddle is the best of both worlds, since the call gives you the right to buy the stock at strike price A and the put gives you the right to sell the stock at strike price A. But those rights don’t come cheap...
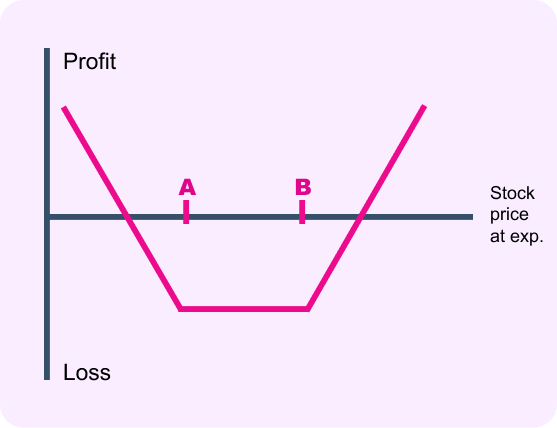
Long Strangle
A long strangle gives you the right to sell the stock at strike price A and the right to buy the stock at strike price B...

Back Spread w/Calls
This is an interesting and unusual strategy. Essentially, you’re selling an at-the-money short call spread in order to help pay for the extra out-of-the-money long call at strike B.

Back Spread w/Puts
This is an interesting and unusual strategy. Essentially, you’re selling an at-the-money short put spread in order to help pay for the extra out-of-the-money long put at strike A.

Long Calendar Spread w/Calls
When running a calendar spread with calls, you’re selling and buying a call with the same strike price, but the call you buy will have a later expiration date than the call you sell. You’re taking advantage of accelerating time decay on the front-month (shorter-term) call as expiration approaches...
Long Calendar Spread w/Puts
When running a calendar spread with puts, you’re selling and buying a put with the same strike price, but the put you buy will have a later expiration date than the put you sell. You’re taking advantage of accelerating time decay on the front-month (shorter-term) put as expiration approaches...

Diagonal Spread w/Calls
You can think of this as a two-step strategy. It’s a cross between a long calendar spread with calls and a short call spread . It starts out as a time decay play...

Diagonal Spread w/Puts
You can think of this as a two-step strategy. It’s a cross between a long calendar spread with puts and a short put spread . It starts out as a time decay play...

Long Butterfly w/Calls
A long call butterfly spread is a combination of a long call spread and a short call spread, with the spreads converging at strike price B.
Long Butterfly w/Puts
A long put butterfly spread is a combination of a short put spread and a long put spread , with the spreads converging at strike B...
Iron Butterfly
You can think of this strategy as simultaneously running a short put spread and a short call spread with the spreads converging at strike B. Because it’s a combination of short spreads, an iron butterfly can be established for a net credit...

Skip Strike Butterfly w/Calls
You can think of this strategy as embedding a short call spread inside a long call butterfly spread . Essentially, you’re selling the short call spread to help pay for the butterfly. Because establishing those spreads separately would entail both buying and selling a call with strike C, they cancel each other out and it becomes a dead strike...

Skip Strike Butterfly w/Puts
You can think of this strategy as embedding a short put spread inside a long put butterfly spread . Essentially, you’re selling the short put spread to help pay for the butterfly. Because establishing those spreads separately would entail both buying and selling a put with strike B, they cancel each other out and it becomes a dead strike...

Inverse Skip Strike Butterfly w/Calls
You can think of this strategy as a back spread with calls with a twist. Instead of simply running a back spread with calls (sell one call, buy two calls), selling the extra call at strike D helps to reduce the overall cost to establish the trade.

Inverse Skip Strike Butterfly w/Puts
You can think of this strategy as a back spread with puts with a twist. Instead of simply running a back spread with puts (sell one put, buy two puts), selling the extra put at strike A helps to reduce the overall cost to establish the trade.

Christmas Tree Butterfly w/Calls
You can think of this strategy as simultaneously buying one long call spread with strikes A and C and selling two short call spreads with strikes C and D. Because the long call spread skips over strike B...

Christmas Tree Butterfly w/Puts
You can think of this strategy as simultaneously buying one long put spread with strikes D and B and selling two short put spreads with strikes B and A. Because the long put spread skips over strike C...

Long Condor Spread w/Calls
You can think of a long condor spread withcalls as simultaneously running an in-the-money long call spread and an out-of-the-money short call spread . Ideally, you want the short call spread to expire worthless, while the long call spread achieves its maximum value with strikes A and B in-the-money...
Long Condor Spread w/Puts
You can think of put condor spread as simultaneously running an in-the-money short put spread and an out-of-the-money long put spread . Ideally, you want the short put spread to expire worthless, while the long put spread achieves its maximum value with strikes C and D in-the-money.
Iron Condor
You can think of this strategy as simultaneously running an out-of-the-money short put spread and an out-of-the-money short call spread . Some investors consider this to be a more attractive strategy than along condor spread with calls or puts because you receive a net credit into your account right off the bat...


